May 25, 2012
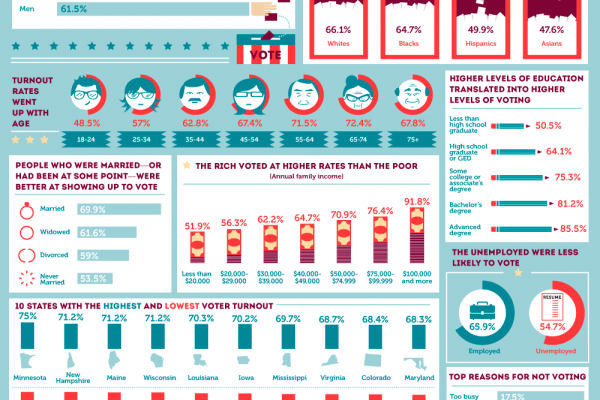
Take Part on Tuesday has created to great infographic that shows who actually votes in America.
Some of the highlights:
- Married people are more likely to vote than widowers, divorcees or those who have never been married.
- The higher the level of education you have received, the more likely you are to vote.
- More than 9-in-10 people with an annual family income of over $100,000 vote, compared with just 5-in-10 whose income falls below $20,000.
- Our busy lives are the number one reason why we don’t vote.
- Congratulations to Minnesotans – your state tops state-by-state voter turnout with 75%
- Must do better: Hawaii - only half of Hawaiians voted in the 2008 election.
Read the Full Article

Already a subscriber? Login